
5 Charts That Show the Monumental Rise of NFTs
In just over a year, NFTs have absolutely exploded. No, seriously. NFTs are everywhere in 2022. From taking over Super Bowl LVI and making their way into March Madness to helping define this year’s Coachella and stealing the spotlight at SXSW, nonfungible tokens have continued to dominate pup culture.
Yet, beyond public appearances and million-dollar sale headlines, the growth of the NFT ecosystem itself might be the most jaw-dropping aspect of this whole “NFT craze.” Despite the fact that NFT sales have dipped significantly from their landmark high at the start of 2022 when we zoom out on the bigger picture, it’s clear that this exponential growth has helped create a new (and lasting) creative economy.
So, now that it’s been just over a year past Beeple’s landmark $69 million Christie’s auction, what does the NFT market look like? Well, let’s check the charts.
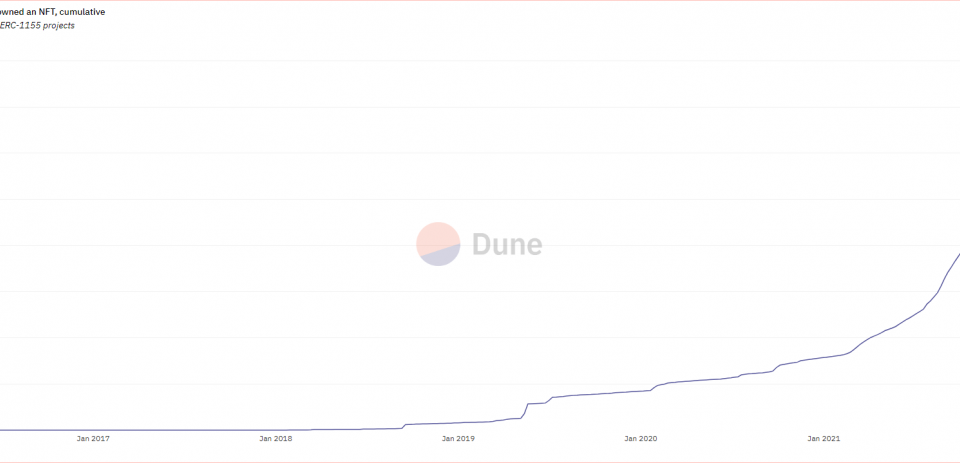
Cumulative # of wallets that have ever owned an NFT
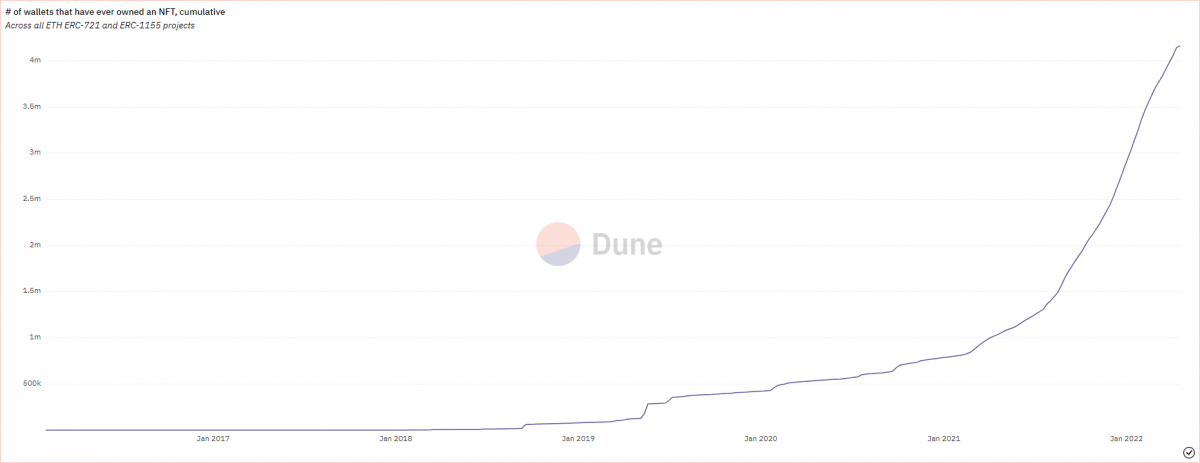
It’s no secret that the NFT ecosystem has absolutely exploded in recent years, but it’s charts like the above that show the true scale of how large the market has become. When NFTs first started to gain traction in 2020, only a few hundred thousand wallets had ever owned an NFTs. Now in 2022, that number is well over four million.
Weekly # of unique wallets that have traded an NFT
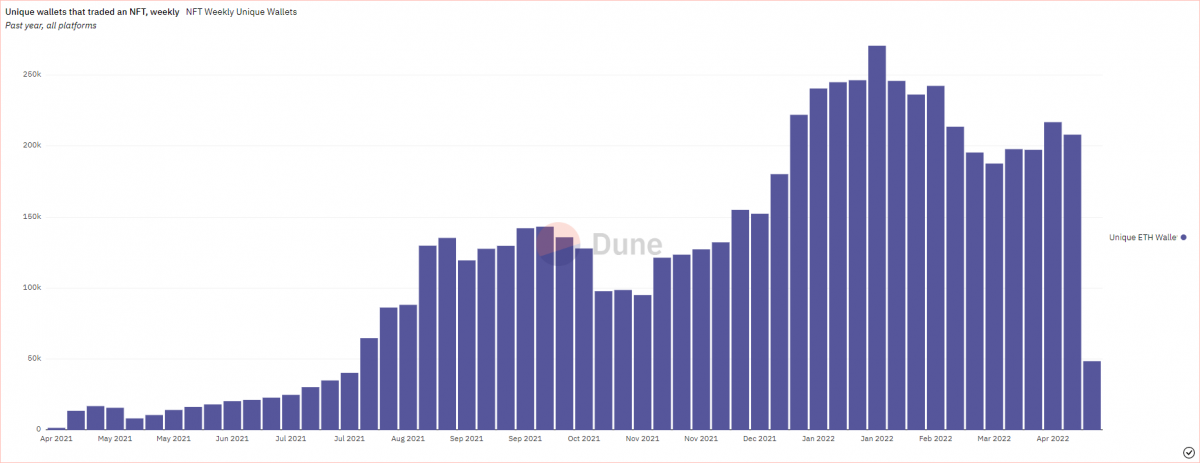
Ownership isn’t the only metric we can measure NFT market growth by — as trading NFTs is the true catalyst to market movement. Of course, some wallets may have obtained an NFT then stagnated, but this one-year chart dating from April 2021 to April 2022 shows that there were only a few thousand unique wallets trading NFTs in April 2021, vs. well over 200,000 in the first few months of 2022.
Daily # of Ethereum NFT Transfers
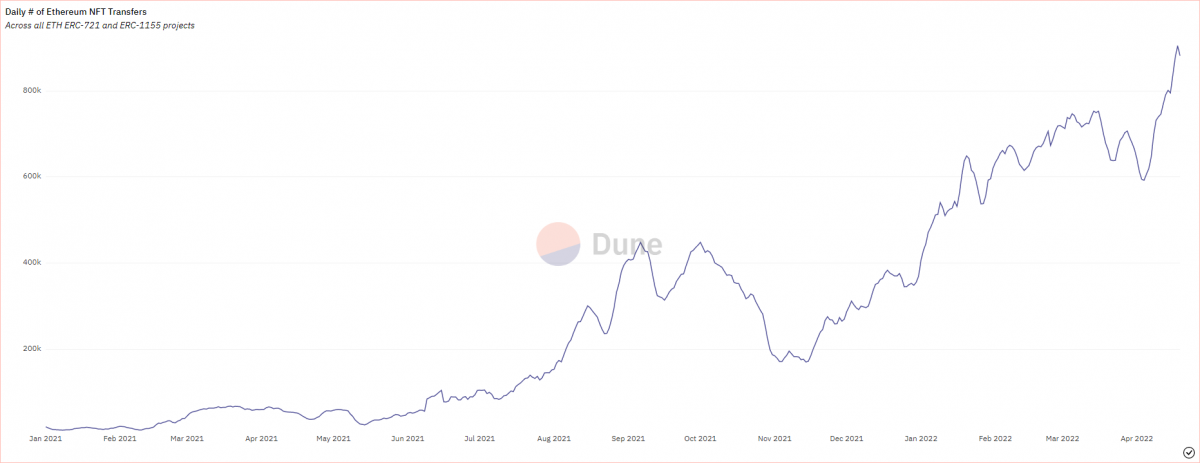
Of course, if the number of active traders is great, the number of daily transactions must be astronomical, right? The above chart details just how large of a difference a year can make. We can see by the data compiled that NFTs started to take off in March 2021. The market then hit a bit of a lull throughout the spring and summer before numbers again turned skyward. And the trend still continues. With the number of daily Ethereum NFT transfers on its way into the millions in 2022.
OpenSea’s monthly USD sales volume
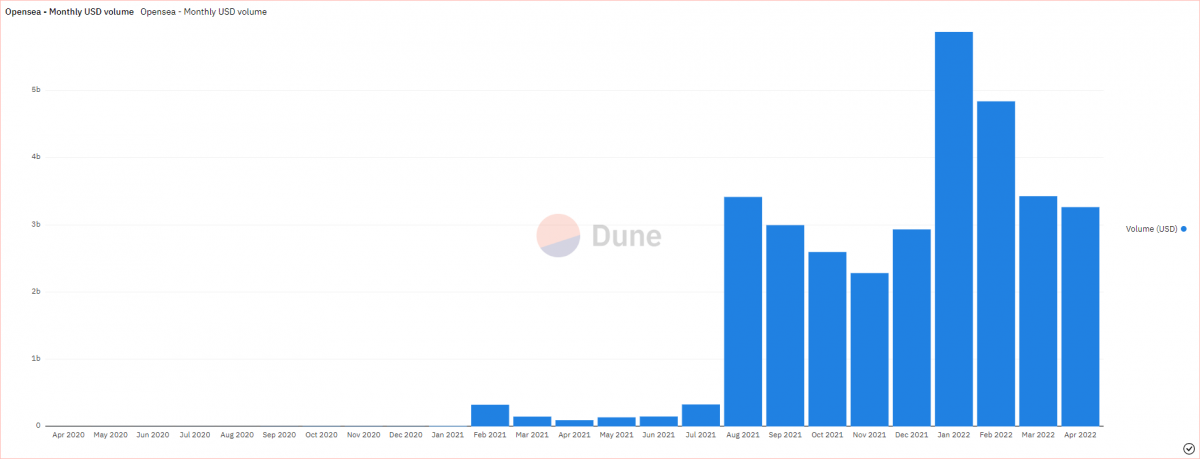
Over the past year, the vast majority of Ethereum NFT trades have taken place via OpenSea — the world’s largest NFT marketplace. Although this is slowly changing as competitors like LooksRare and Rarible continue to expand, data between April 2020 and April 2022 shows a growing pattern of spikes and dips. In August 2021, it was big news when OpenSea not only crossed the billion-dollar threshold but flew straight past three billion. Now, these figures are a monthly occurrence.
Median NFT sales prices
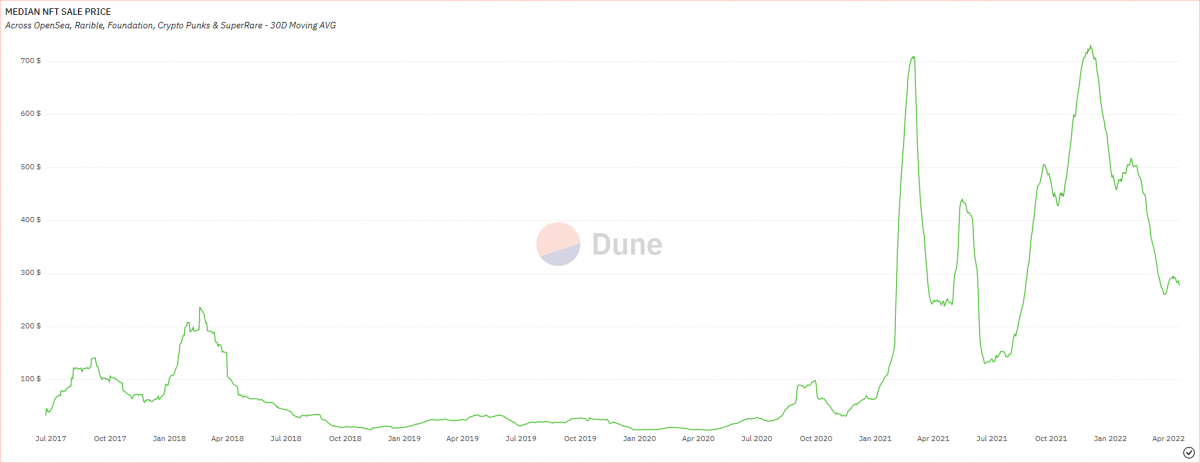
We’ve all heard of folks making millions off of NFTs. But this is by no means the norm of NFT trading. Yes, the ecosystem has exploded but the majority of NFT enthusiasts truly never see riches like that of early Bored Ape Yacht Club supporters. This last chart shows this staunch difference. While median NFT sales prices have of course seen a major uptick in the last year, it’s been at a rate of hundreds of dollars, not thousands or millions. Furthermore, the pattern is inconsistent, looking like more of a seismograph reading than a visual representation of data — serving to illustrate both the growth of the NFT market and its inconsistency all the same.
The post 5 Charts That Show the Monumental Rise of NFTs appeared first on nft now.