80+ Instagram Stats You Need to Know in 2023
It feels like Instagram, more than any other social media platform, is evolving at a dizzying pace. As it continues to roll out new features, updates, and algorithm changes, it can be hard to keep up.
That’s where the Instagram stats comes in. There’s a whole lot of research out there about Instagram — everything from the demographics of its users and its reach, to how negative space affects the performance of your posts (hint, hint: #68).
Read on to uncover more social media stats that’ll help you get ideas and improve your own Instagram posting strategy.
80+ Instagram Stats
Click on a category below to jump to the stats for that category:
- Instagram’s Growth
- Audience & Demographics
- Brand Adoption
- Instagram Post Content
- Instagram Posting Strategy
Instagram’s Growth & Usage
1. Instagram is expected to reach 1.44 billion users by 2025. (Source)
2. The Instagram app has over 78 million monthly active users. (Source)
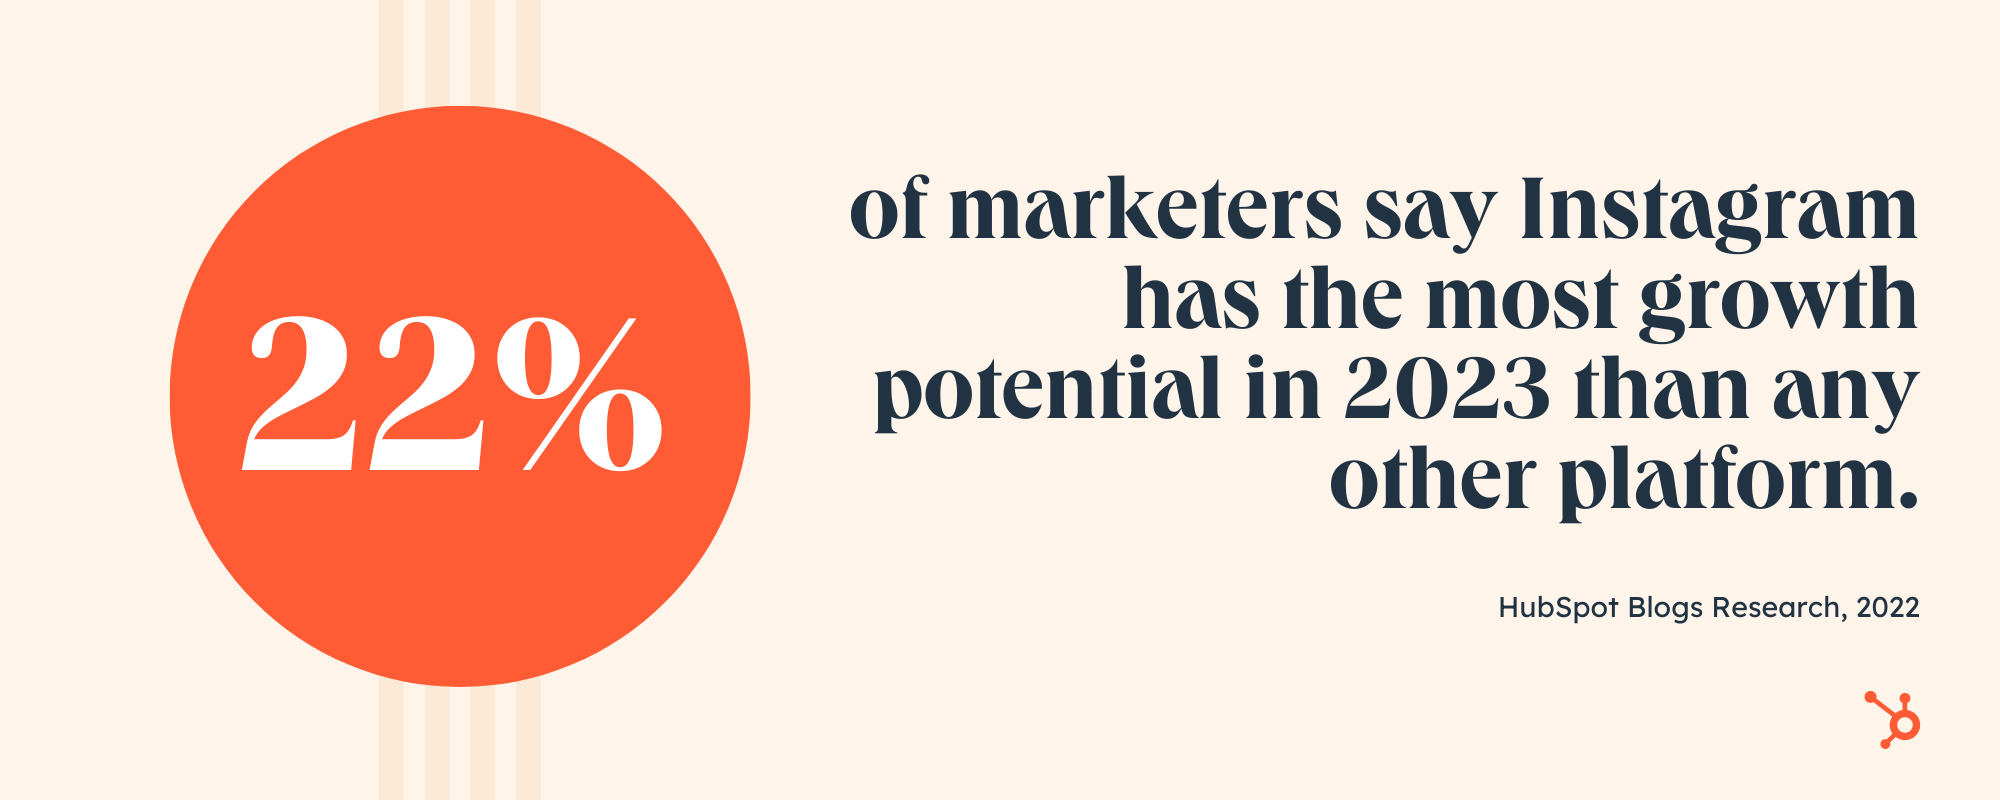
3. 22% of marketers say Instagram has the most growth potential in 2023 than any other platform. (Source)

4. Instagram saw a 48% increase in ad reach from January 2020 to January 2022. (Source)
5. Almost a quarter of marketers (23%) predict that Instagram will offer brands the biggest potential to grow their audience in 2023. (Source)
6. Instagram is the most-used platform for influencer marketing in the U.S. (Source)
7. Marketers say Instagram is the social media platform they know how to use best. (Source)
8. There are an estimated 143 million Instagram users in the United States in 2023. (Source)
9. As of January 2023, India has a total of 229 million Instagram users, the largest Instagram audience in the world. (Source)
10. As of January 2022, Instagram was the fourth most popular social media platform in the world in terms of user numbers. YouTube and WhatsApp ranked in second and third place. (Source)
11. On average, U.S. adults spend 30.1 minutes a day on Instagram in 2022. (Source)
.png?width=2000&height=820&name=instagram%20statistics%20(4).png)
12. As of February 2023, the most-liked post on Instagram is a carousel of Argentine footballer Lionel Messi and his teammates celebrating the 2022 FIFA World Cup win. (Source)
13. Between January and June 2022, the fastest-growing content creator on Instagram was influencer Jorge Gomez, with 573% growth in six months. (Source)
14. Other than Instagram’s own account, the most-followed Instagram account as of January 2023 is professional soccer player Cristiano Ronaldo. (Source)
15. As of May 2022, Instagram’s own account has 504.37 million followers. (Source)
Audience & Demographics
16. More than half of the global Instagram population is 34 years of age or younger. (Source)
17. As of January 2023, almost 17% of global active Instagram users were men between the ages of 18 and 24 years. (Source)
18. Millennials ranked Instagram as their favorite social media app in 2022. (Source)
-1.png?width=2000&height=800&name=Is%20Instagram%20Dying%202022%20(3)-1.png)
19. Gen Z-ers also ranked Instagram as their favorite social media app in 2022. (Source)
20. TikTok and Instagram are the most used social media apps among Gen Z women. (Source)
21. In December 2022, 55% of Instagram users in the United States were women and 44% percent were men. (Source)
22. Only 7% of Instagram users in the U.S. belong to the 13 to 17 year age group. (Source)
23. Only 4.7% of Instagram users in the U.S. are 65 plus. (Source)
24. As of 2022, 82% of Instagram users also use Facebook. (Source)
25. 47% of U.S. Instagram users make more than 75,000 per year. (Source)
26. Instagram users worldwide spend an average of 11 hours per month on the Instagram app on Android phones. This number drops to 7 hours for U.S. users. (Source)
27. 72% of teens use Instagram, and 57 million U.S. teenagers say Instagram is their preferred social media platform. (Source)
28. 500 million+ accounts use Instagram Stories every day. (Source)
29. 35% of music listeners in the U.S. who follow artists on Facebook and Instagram do so to connect with other fans or feel like part of a community. (Source)

30. The average Instagram user spends 30 minutes a day on the app. (Source)
31. 45% of Instagram users live in urban areas. (Source)
Brand Adoption
32. 72% of marketers work with influencers/creators on Instagram. (Source)
33. 29% of marketers plan to invest the most in Instagram out of any social media platform in 2023. (Source)
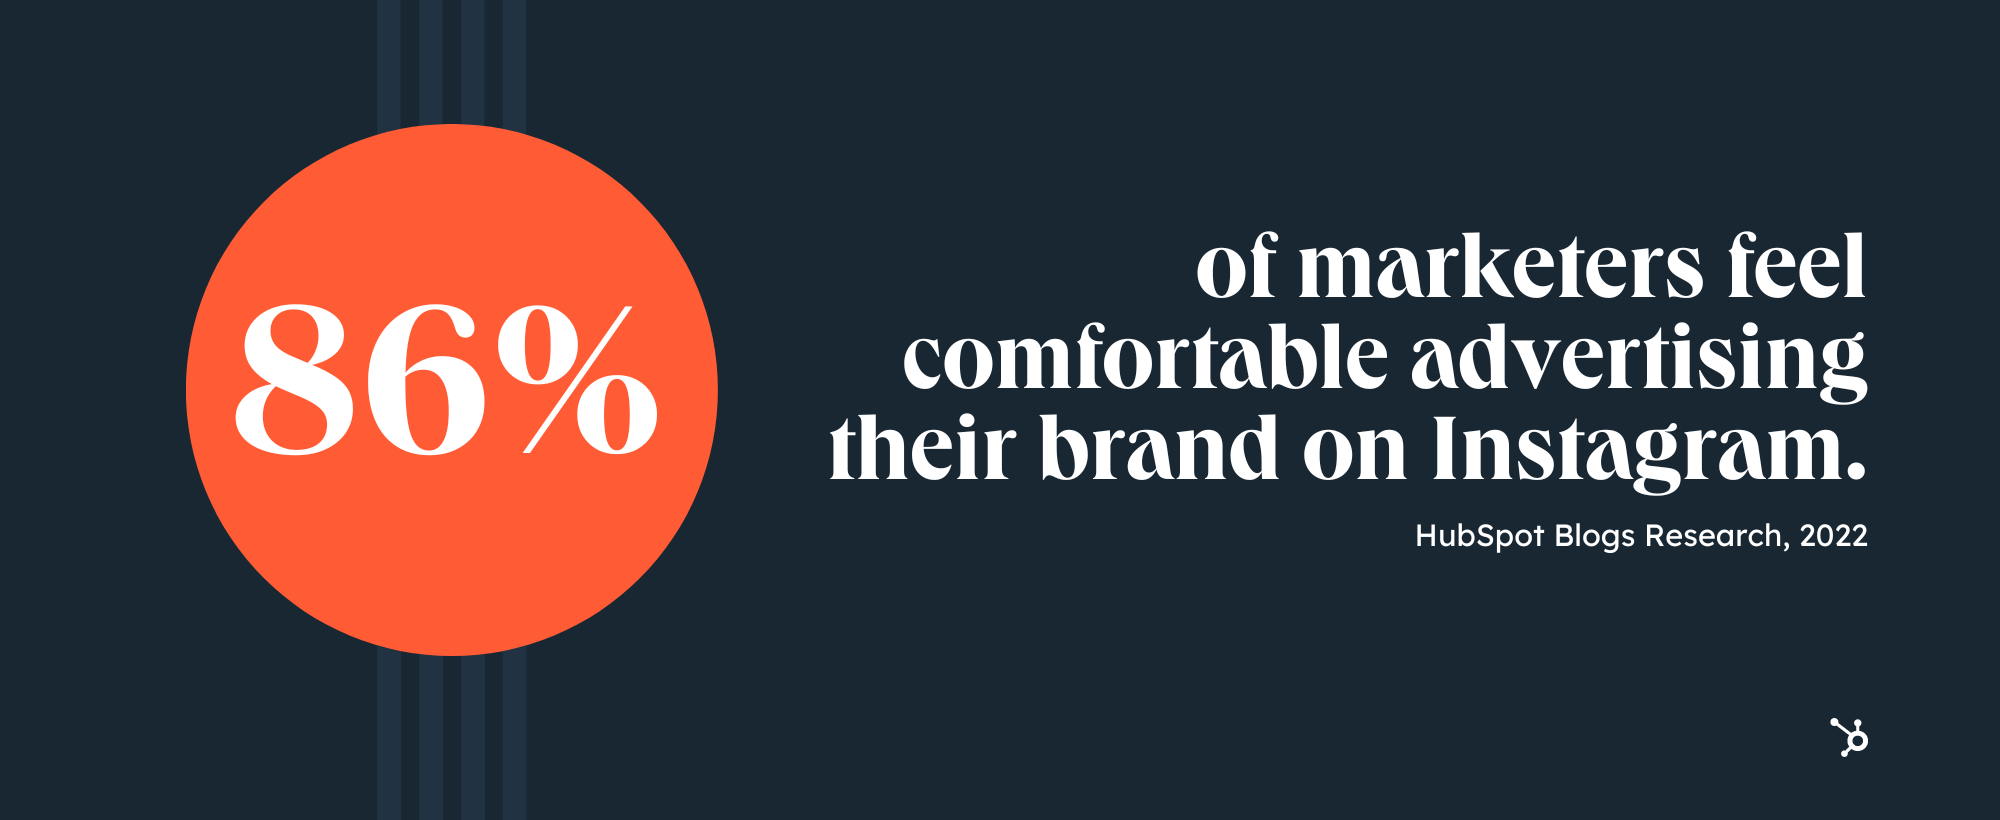
34. In terms of brand safety, 86% of marketers feel comfortable advertising on Instagram. (Source)

35. 53% of marketers say Instagram has high ROI. Only 7% of marketers say Instagram has low ROI. (Source)
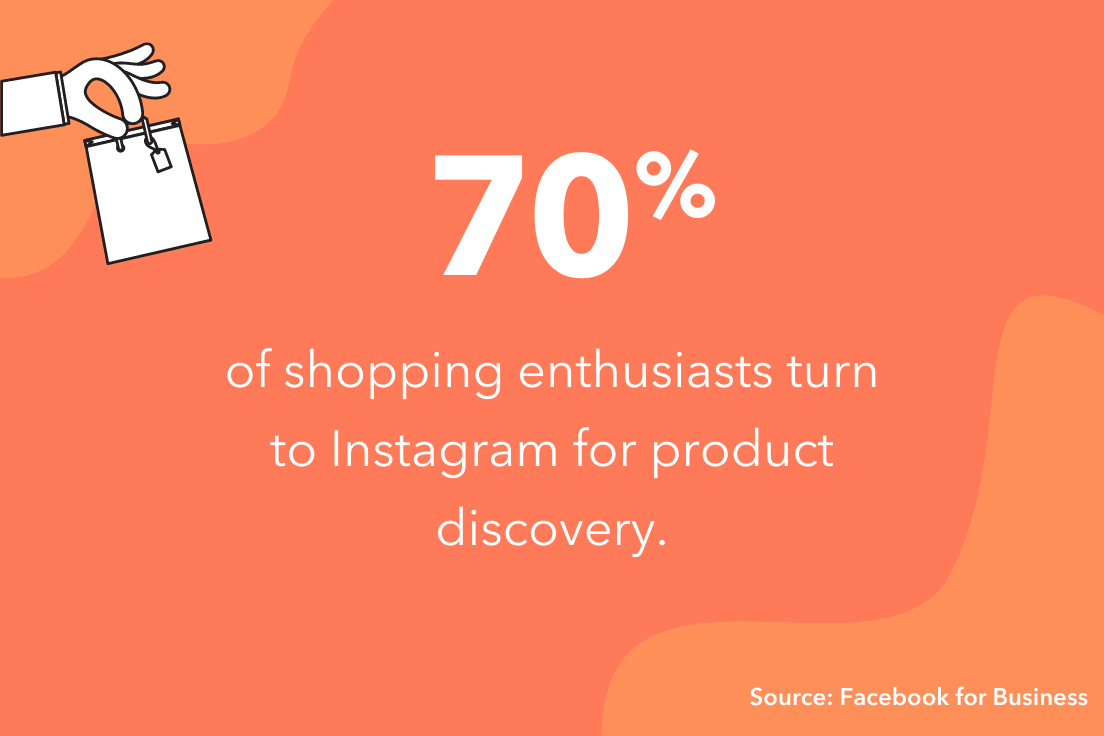
36. 70% of shopping enthusiasts turn to Instagram for product discovery. (Source)
37. Marketers saw the highest engagement rates on Instagram out of any other platform in 2022. (Source)
38. 32% of marketers say Instagram is the easiest platform for working with influencers and creators. (Source)
39. 1 in 4 marketers say Instagram has resulted in the highest ROI out of any platform in 2022. (Source)
40. 27% of marketers plan to use Instagram the most for working creators and influencers in 2023. (Source)
41. More than half of marketers plan to increase their investment in Instagram in 2023. (Source)
.png?width=2000&height=820&name=Instagram%20statistics%20(5).png)
42. In 2022, marketers saw the highest engagement rates on Instagram for user generated content. (Source)
43. Only 8% of marketers plan to decrease their investment in Instagram in 2023. (Source)
44. 36% of marketers plan to leverage Instagram for the first time in 2023. (Source)
45. 90% of people on Instagram follow at least one business. (Source)
46. 50% of Instagram users are more interested in a brand when they see ads for it on Instagram. (Source)
47. When it comes to posting organic content, 27% of marketers say Instagram offers the highest ROI for this type of content. (Source)
48. 1 in 4 marketers say Instagram provides the highest quality leads out of any social media platform. (Source)
.png?width=2000&height=820&name=instagram%20statistics%20(1).png)
49. Nearly a quarter of marketers (23%) say Instagram is the most effective platform for brands looking to build a social media strategy for the first time in 2023. (Source)
50. 46% of marketers leverage Instagram Shops. Of the marketers who leverage Instagram Shops, 50% report high ROI. (Source)
51. 41% of marketers leverage Instagram Live Shopping. Of the marketers who leverage Instagram Live Shopping, 51% report high ROI. (Source)
52. In a 2021 report, the higher education industry currently has the highest engagement rate of any other industry per post on Instagram, at 3.19%. Second was sports teams at 1.79%, and third was influencers at 1.42%. (Source)
53. 67% of users surveyed have ‘swiped up’ on the links of branded Stories. (Source)
54. 130 million Instagram accounts tap on a shopping post to learn more about products every month. (Source)
Instagram Post Content
55. Engagement for static photos has decreased by 44% since 2019, around the time Reels made its debut. (Source)
56. The average engagement rate for photo posts is 1.18%. (Source)
57. The average engagement rate for carousel posts is 3.15% (Source)
58. As of January 2022, #love is the most popular hashtag on Instagram. Over two billion posts use this hashtag. (Source)
59. Marketers rank Instagram as the platform with the best in-app search capabilities. (Source)
60. The most popular Instagram Reel has 289+ million views. (Source)
61. Marketers rank Instagram as the platform with the most accurate algorithm, followed by Facebook. (Source)
.png?width=2000&height=820&name=Instagram%20statistics%20(2).png)
62. A third of marketers say Instagram offers the biggest ROI when selling products directly within the app. (Source)
63. As of 2021, 9 out of 10 users watch Instagram videos weekly. (Source)
64. A third of marketers say Instagram offers the best tools for selling products directly within the app. (Source)
65. 995 photos are uploaded on Instagram every second. (Source)
66. The median posting cadence across all industries is 4 posts per week. The median posting frequency declined by just 8% this year compared to last. (Source)
67. On Instagram, photos showing faces get 38% more Likes than photos not showing faces. (Source)
68. On Instagram, images with a high amount of negative space generate 29% more Likes than those with minimal negative space. (Source)

69. On Instagram, images featuring blue as the dominant color generate 24% more Likes than images that are predominantly red. (Source)
70. This is so much so that the latest Instagram statistics show that an average Instagram post contains as many as 10.7 hashtags. (Source)
71. Image posts received 27.55% more likes than permanent video posts. (Source)
72. An average image on Instagram gets 23% more engagement than one published on Facebook. (Source)
73. The most geo-tagged city in the world is Los Angeles, California and the tagged location with the highest engagement is Coachella, California. (Source)
Instagram Posting Strategy
74. The best time to post on Instagram is Friday between 6 p.m. and 9 p.m. in your respective time zone. (Source)
.png?width=2000&height=820&name=instagram%20statistics%20(3).png)
75. Posts with a tagged location result in 79% higher engagement than posts without a tagged location. (Source)
76. 20% of users surveyed post to Instagram Stories on their business account more than once a week. (Source)
77. 44% of users surveyed use Instagram Stories to promote products or services. (Source)
78. One-third of the most viewed Stories come from businesses. (Source)
79. More than 25 million businesses now use Instagram to reach and engage with audiences. (Source)
80. 69% of US marketers plan to spend most of their influencer budget on Instagram. (Source)
81. The industry that had the highest cooperation efficiency with Instagram influencers was Health Care, where influencer posts were 4.2x more efficient than brand posts. (Source)
82. Instagram is now the most popular social platform for following brands. (Source)
![]()


![Download Now: The State of Social Media Trends [Free Report]](https://no-cache.hubspot.com/cta/default/53/3dc1dfd9-2cb4-4498-8c57-19dbb5671820.png)
