
Which Social Media Metrics Are Marketers Tracking? [New Research]
We get it: Social media metrics are important. Getting data and ROI is really important. However, if you spend too much time trying to figure out which metrics are important for your business, you won’t have any time to analyze and act upon them.
That’s why we’ve made a list of the social media metrics that are essential to track, so you don’t miss out on important numbers that can help you later. These metrics will give you insight into customers, how to track ROI, improve your brand presence online, and walk away with happier customers.
Social Media Metrics are imperative to social strategy. They give you an inside look at how your channels are performing and how you are perceived by your target audience. They can also give provide you with ways to improve upon your strategy.

1. Audience growth rate
To measure your audience growth rate, begin by selecting a reporting period. Then, calculate your new followers over that specific period. After that, you’d need to divide your new followers by your total followers.
So let’s say your brand’s Twitter account has 6,000 followers in September, at the end of Q3. For Q4, you want to measure your audience growth rate from October 1st to December 31st. If by December 31st, you have 8,657 followers, then your audience growth rate for Q4 is 69%.
2. Social Media Impressions
Let’s say you decided to run a paid ad campaign across your company’s key social media platforms. Do you know how many people came across your ad? Social media impressions measure how many users were exposed to your content, and it’s a metric worth tracking.
Understanding your social media impressions is important because this data can provide valuable insight into how far your ad spend can go and can help inform future paid ad spend so you can maximize your budget.
However, even if paid ads aren’t a part of your strategy, you may still want to look into how many impressions your social media content is gathering over time. This data can tell you how different types of content are resonating with your audience across platforms.
It’s also worth noting that each social media platform measures impressions differently. For example, on Twitter, each user that sees a tweet is considered an impression. On Facebook, each time a paid ad is seen on screen, it is considered an impression. Instagram counts an impression each time a user views a piece of content (such as a static post, story, Reel, or IGTV). On TikTok, there is not an “impressions” measurement defined in the app’s analytics section, however, for your own data you could consider each video view an impression.
3. Social Media Conversion Rate
Your conversion rate is made up of the number of visitors to your website that take your desired action. This might mean that they downloaded your eBook, signed up for your newsletter, or clicked “Play” on your podcast. Conversion rates show how relevant your content is to your audience.
If you want to calculate the conversion rate, start by making sure your call-to-action link is trackable. You can do this by using a free, online URL shortener like Bitly. Next, analyze your campaign to identify the number of clicks and conversions your page has gained.
After that, divide your conversions by total clicks and multiply it by conversion rate. If your webpage has about 750 clicks and 200 conversions, then your conversion rate is 26.6%. Keep in mind that conversion rate numbers are not mutually exclusive, and can be low even if traffic is high.
4. Social share of voice
How many people are talking about your brand on social channels? Let’s find out.
Your social share of voice measures this data and shows how visible your brand is on social media. Finding these numbers could tell you whether you need to update your social strategy or not.
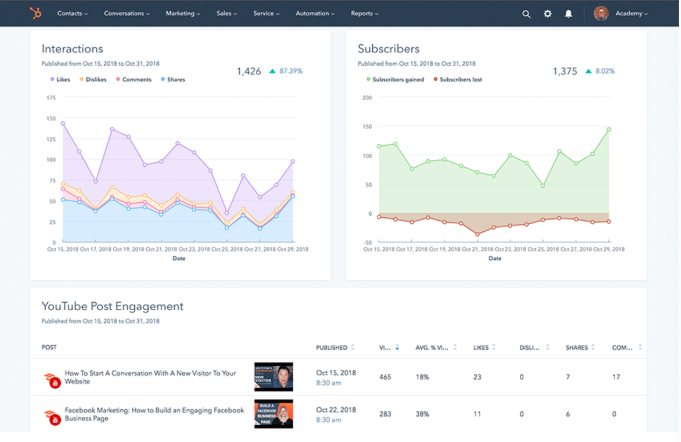
To calculate your social share of voice, measure your mentions across your social networks. Hint: Your social media analytics tools can be helpful when calculating this number. Next, add your mentions in tandem with the mentions of competitors, which can be tracked using an online social media tool like Sprout Social. This gives you the total industry number of mentions. Here is an example of what metrics of engagement would look like:
After you divide your brand mentions by the total industry number, multiply this number by 100 to get the social share of voice percentage.
Let’s put this in perspective. Over a week, your brand has been mentioned directly and indirectly 100 times. Three competitors have 500 mentions, plus yours equals 600. Taking 100 divided by 600 and multiplying that number by 100 means your Social Share of Voice is 16.67%.
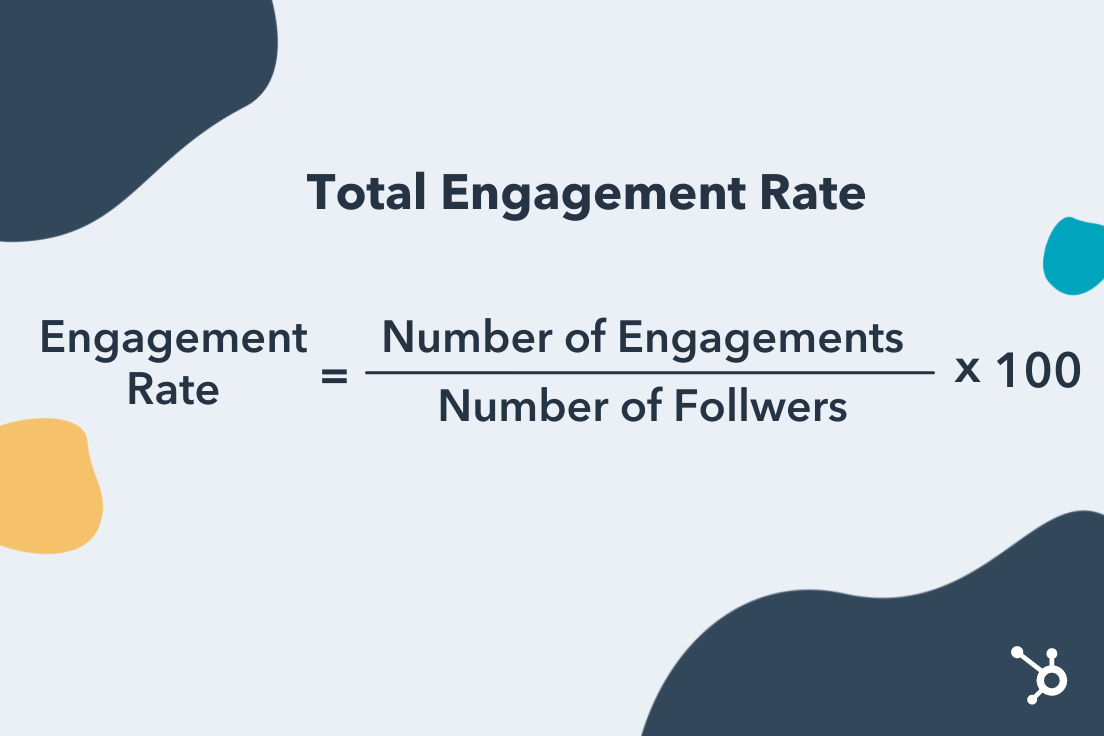
5. Social Media Engagement Rate
According to Kelly Hendrickson, Senior Manager of Social Media at HubSpot, engagement is a crucial metric for understanding social media performance.
She says, “No matter the scale of your business or social audience, quality engagement is what I always focus on. Where best-in-class social media marketing is a delicate balance behind providing your audience value while meeting business needs, your engagement rate is an indicator if you’re tipping the scales in the wrong direction. Audience first.”
Social media engagement is the total number of likes, comments, shares, and general interactions a piece of content or social media account receives relative to the size of the audience. Having a large following isn’t useful if the audience isn’t regularly interacting with the content they follow.
To measure the overall engagement rate of a social media account, you can use the following formula:
Engagement Rate = Number of Engagements / Number of Followers x 100
Here’s how each major social media platform measures engagement:
- Instagram: Likes, Shares, Saves, Comments, Direct Messages
- Facebook: Click-throughs, Comments, Reactions, Shares
- TikTok: Likes, Comments, Shares
- Twitter: Likes, Comments, Retweets
- Pinterest: Pins, Likes, Comments
- LinkedIn: Reactions, Comments, Shares, Click-throughs
- YouTube: Likes and Dislikes, Comments, Shares
6. Keywords
Tracking keywords can grow your social share of voice and audience growth rate. Keywords are certain words that search engines identify and target based on what audiences are searching for. A marketer in the tech industry might see the keywords, “Media Marketing,” and “Tech Channels.”
By tracking keywords, you can optimize your content to rank higher on search engines and grow your audience. You can track keywords by using social media analytics software, like Google Analytics or SEMrush.
7. Customer response rate
Customers love to engage with brands via social media.
In fact, in a survey done by Sprout Social, 74% of respondents engage with brands they follow on social media. Whether they’re asking your customer service team questions or leaving your business reviews, make sure you’re answering as many mentions as possible on social media. To track how you’re doing here, check your customer response rate.
To calculate your customer response rate, divide the number of responses you give to your followers/customers by the number of people who engaged with your brand and multiply this by 100.
For example, if you measured a week of engagement, and the number of customers who engaged with your brand was 50, and you responded to half of them, your customer response rate would be 50%.
8. ROI data
This is the big metric, the one you want to see from day one. Depending on your company and industry, ROIs can differ greatly. For social media, you probably want to know if the time and money you’ve spent on social media is turning into customers, sales, or brand awareness.
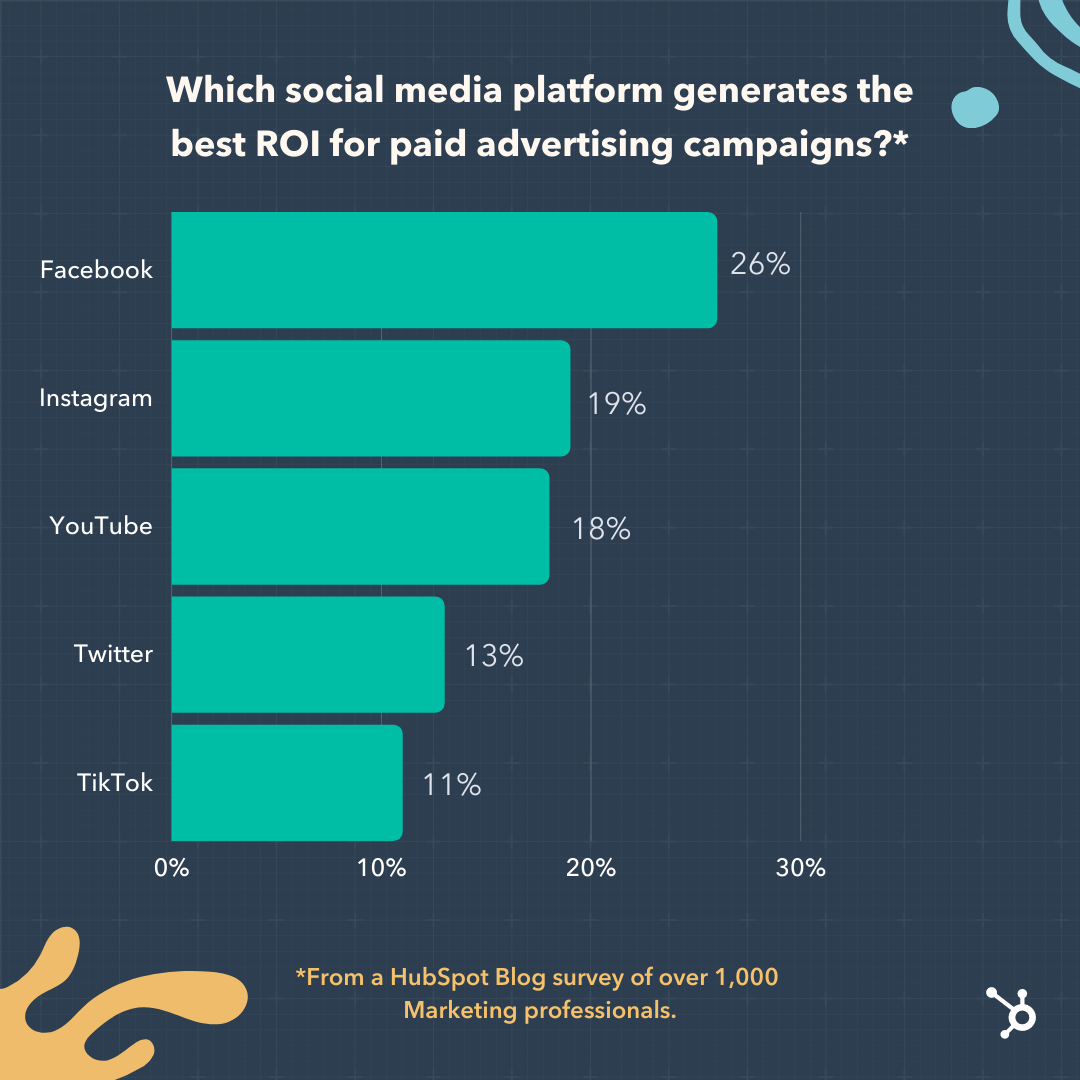
According to a group of 1,000 marketers surveyed by the HubSpot Blog, the following social media platforms generated the biggest ROI for paid advertising campaigns:
- Facebook (26%)
- Instagram (19%)
- YouTube (18%)
- Twitter (13%)
- TikTok (11%)
 In that same survey, marketers said the following metrics were their primary markers of measuring social media ROI in 2022:
- Traffic to Their Website (35%)
- Impressions/Views (31%)
- Clicks (31%)
- Sales (30%)
- Likes/Comments (28%)
Since ROI looks different from one business to the next and calculations are based on your business goals, not every formula will look the same. But, use this formula to figure out a basic ROI. Let’s say you made $1500 in revenue from social media ads or eCommerce and your investment was $500. Your ROI is revenue subtracted from investment (1500 minus 500), which makes your profit $1,000 and your ROI 200%.
9. Channel reports
Keeping track of social media data is important so that you know where and how to focus your strategy. For instance, if one of your accounts just isn’t hitting their numbers, a report would let you know and allow you to proactively step in and troubleshoot.
If you need an update about say, channel performance, and follower counts, consider conducting a social media audit or using a social media analytics tool that conducts an audit for you.
10. Cost-per-click (CPC)
This is an important metric if you’re investing in social media. Cost-per-click (CPC) is what you pay per click on a sponsored social media post, like a banner ad. CPC is helpful when determining if your investment is worth continuing.
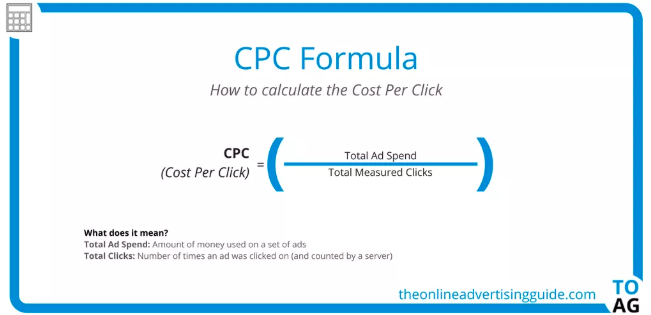
Here is the CPC Formula from The Online Advertising Guide. To view this as an example, say you want to calculate the CPC of your latest round of ads. Divide the total money spent on your ads by the total number of times the ad was clicked on.
11. Net promoter score (NPS)
Net Promoter Score (NPS®) measures customers that are loyal to your brand. It’s the answer you’re looking for when asking customers how likely they are to recommend your business to a friend. Tracking NPS is easier than it seems.
There are three categories that go into tracking NPS. When you ask customers to rate your business 1-10, scorers that answer 9-10 are “Promoters.” “Passives” score 7-8, and “Detractors” are 0-6.
Identifying your NPS is as simple as subtracting “Detractors” from “Promoters” and dividing that by the number of total respondents. Then, multiply that number by 100. So, if you have 50 “Promoters” and 10 “Detractors” from a survey with 70 respondents, your NPS would be 57%.
12. Influencer Campaign Metrics
If your company leverages influencer marketing, you’ll want to measure the effectiveness of your influencer marketing efforts to inform future campaign strategies.
According to the same HubSpot Blog study, the marketers said the most important metrics for measuring the effectiveness of an influencer campaign are:
- Revenue/Sales (40%)
- Brand Awareness (37%)
- Impressions/Views (33%)
- Brand mentions/Hashtag Use (33%)
- Clicks (32%)
As you define the objectives of your influencer marketing campaigns, keep these metrics in mind.
13. Traffic to Brand’s Website
Depending on the nature of your business and the social media platforms your company focuses on, increasing traffic to your website could be a top priority. 41% of marketers surveyed by the HubSpot Blog said traffic to their website is a high-priority metric. If your company relies on web traffic as part of its business strategy, you’ll want to consider measuring how many of your page views are coming directly from social media.
Key platforms for this focus include Facebook, Twitter, and Pinterest. You can use a web traffic tool such as Google Analytics to measure how much of your traffic is coming from organic social media.
14. Audience Insights
Earlier we discussed the importance of understanding your audience growth rate. But how much do you know about the audience you already have? Understanding your followers can help you hone in on finding the right target audience, empowering you to share content that resonates with them resulting in higher engagement and increased ROI.
Key audience demographics to consider include:
- Age
- Location
- Gender
- Education Level
- Job Title
- Marital Status
- Number of People in Household
These demographics can be found on social media platforms such as Instagram, Facebook, and TikTok.
Tracking metrics can sometimes be easy. Sometimes, businesses realize that it’s worth the investment to invest in social media tracking tools to help them run more smoothly.
To learn more about which social media metrics are most important for your own business, check out our video on how to set social media goals:
Next, we’re going to get into some tools that can help you track these metrics.
1. Keyhole
Price: $179/month
Why it’s great: Social listening metrics
Keyhole allows you to see impressions, engagements, reach, and posts that either your accounts or hashtags are getting in a graph format. Keyhole also tracks the demographics of your customers and breaks down their engagement.
When you use Keyhole, all of your accounts are displayed on your dashboard, as pictured below.
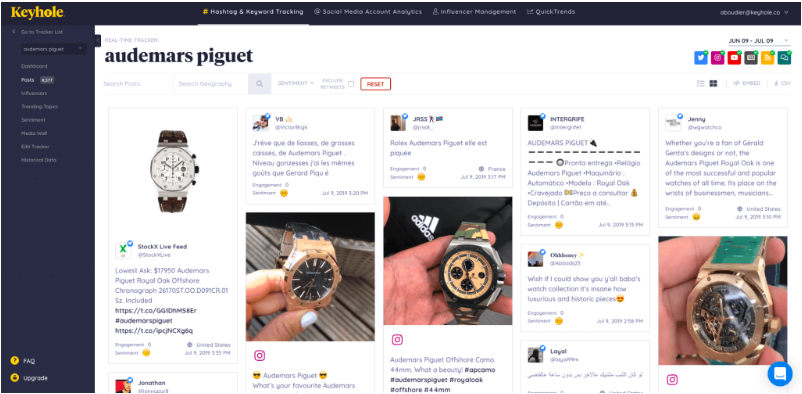
The software shows you what type of content catches the eye of your consumers and provides suggestions on how to improve social presence.
2. Meltwater
Price: By contact
Why it’s great: Timely reporting from dashboard
Meltwater’s program tracks your accounts in real-time, which is accessible from the dashboard of its users. You can also get metrics on your brand’s impact on the web. Meltwater lets you see your insights and user-generated content in one place, like the photo below.
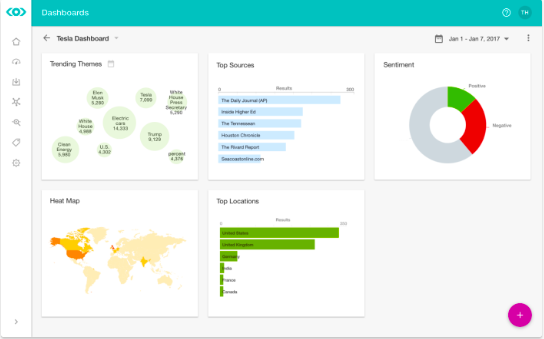
This photo shows where a brand is trending around the world, which themes are trending the most, and SEO results in a couple of different graphs. Meltwater combs the internet for mentions of your brand and even suggests influencers to connect with.
3. NetBase
Price: $300-$1,000/month
Why it’s great: Global insights + tracking
NetBase provides analytics on conversations happening with your brand from around the world. They provide real-time analytics and give you insights that’ll help you track ROI. Like in this photo below, NetBase provides you with data about how your campaigns carry weight with customers.
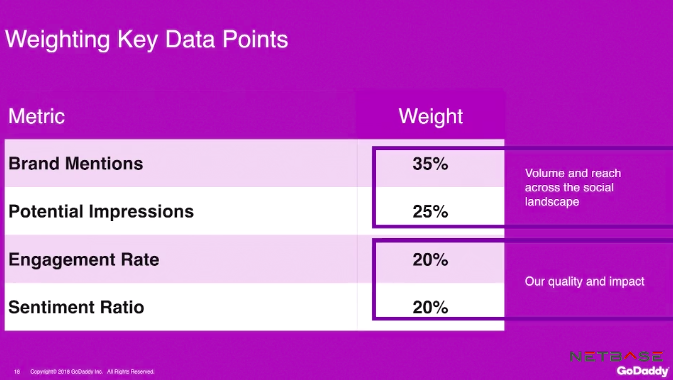
With Netbase, you can track the performance of a campaign and specific elements about certain campaigns that make them stand out. This metric analysis from GoDaddy shows their impact and engagement with customers, as well as the audience they’ve reached.
4. quintly
Price: $300/mo
Why it’s great: See competitor performance
When using quintly, you can not only track your social media performance but gain insight into the performance of your competitors. This will help you see what you can do to improve your campaigns and what your competitors are doing that works. This photo is an example of the insights the software provides.
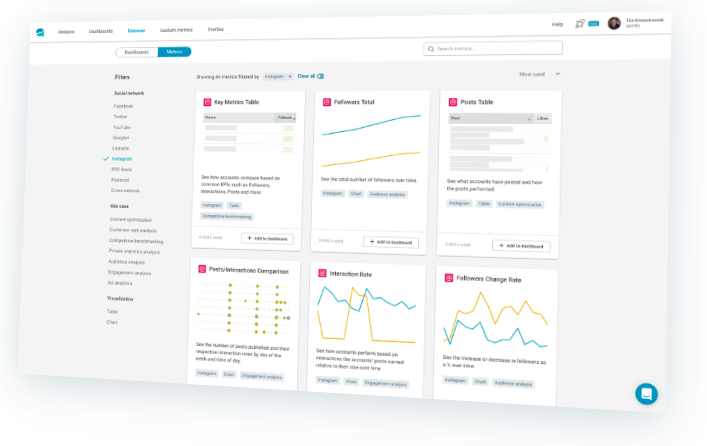
Quintly is also great for agencies with multiple clients. They can use it to manage the accounts of their clients and track their social media pages. Quintly also has reporting and benchmark data to measure campaigns.
![]()